INSIGHTS
Attendance and Exam Score Averages:
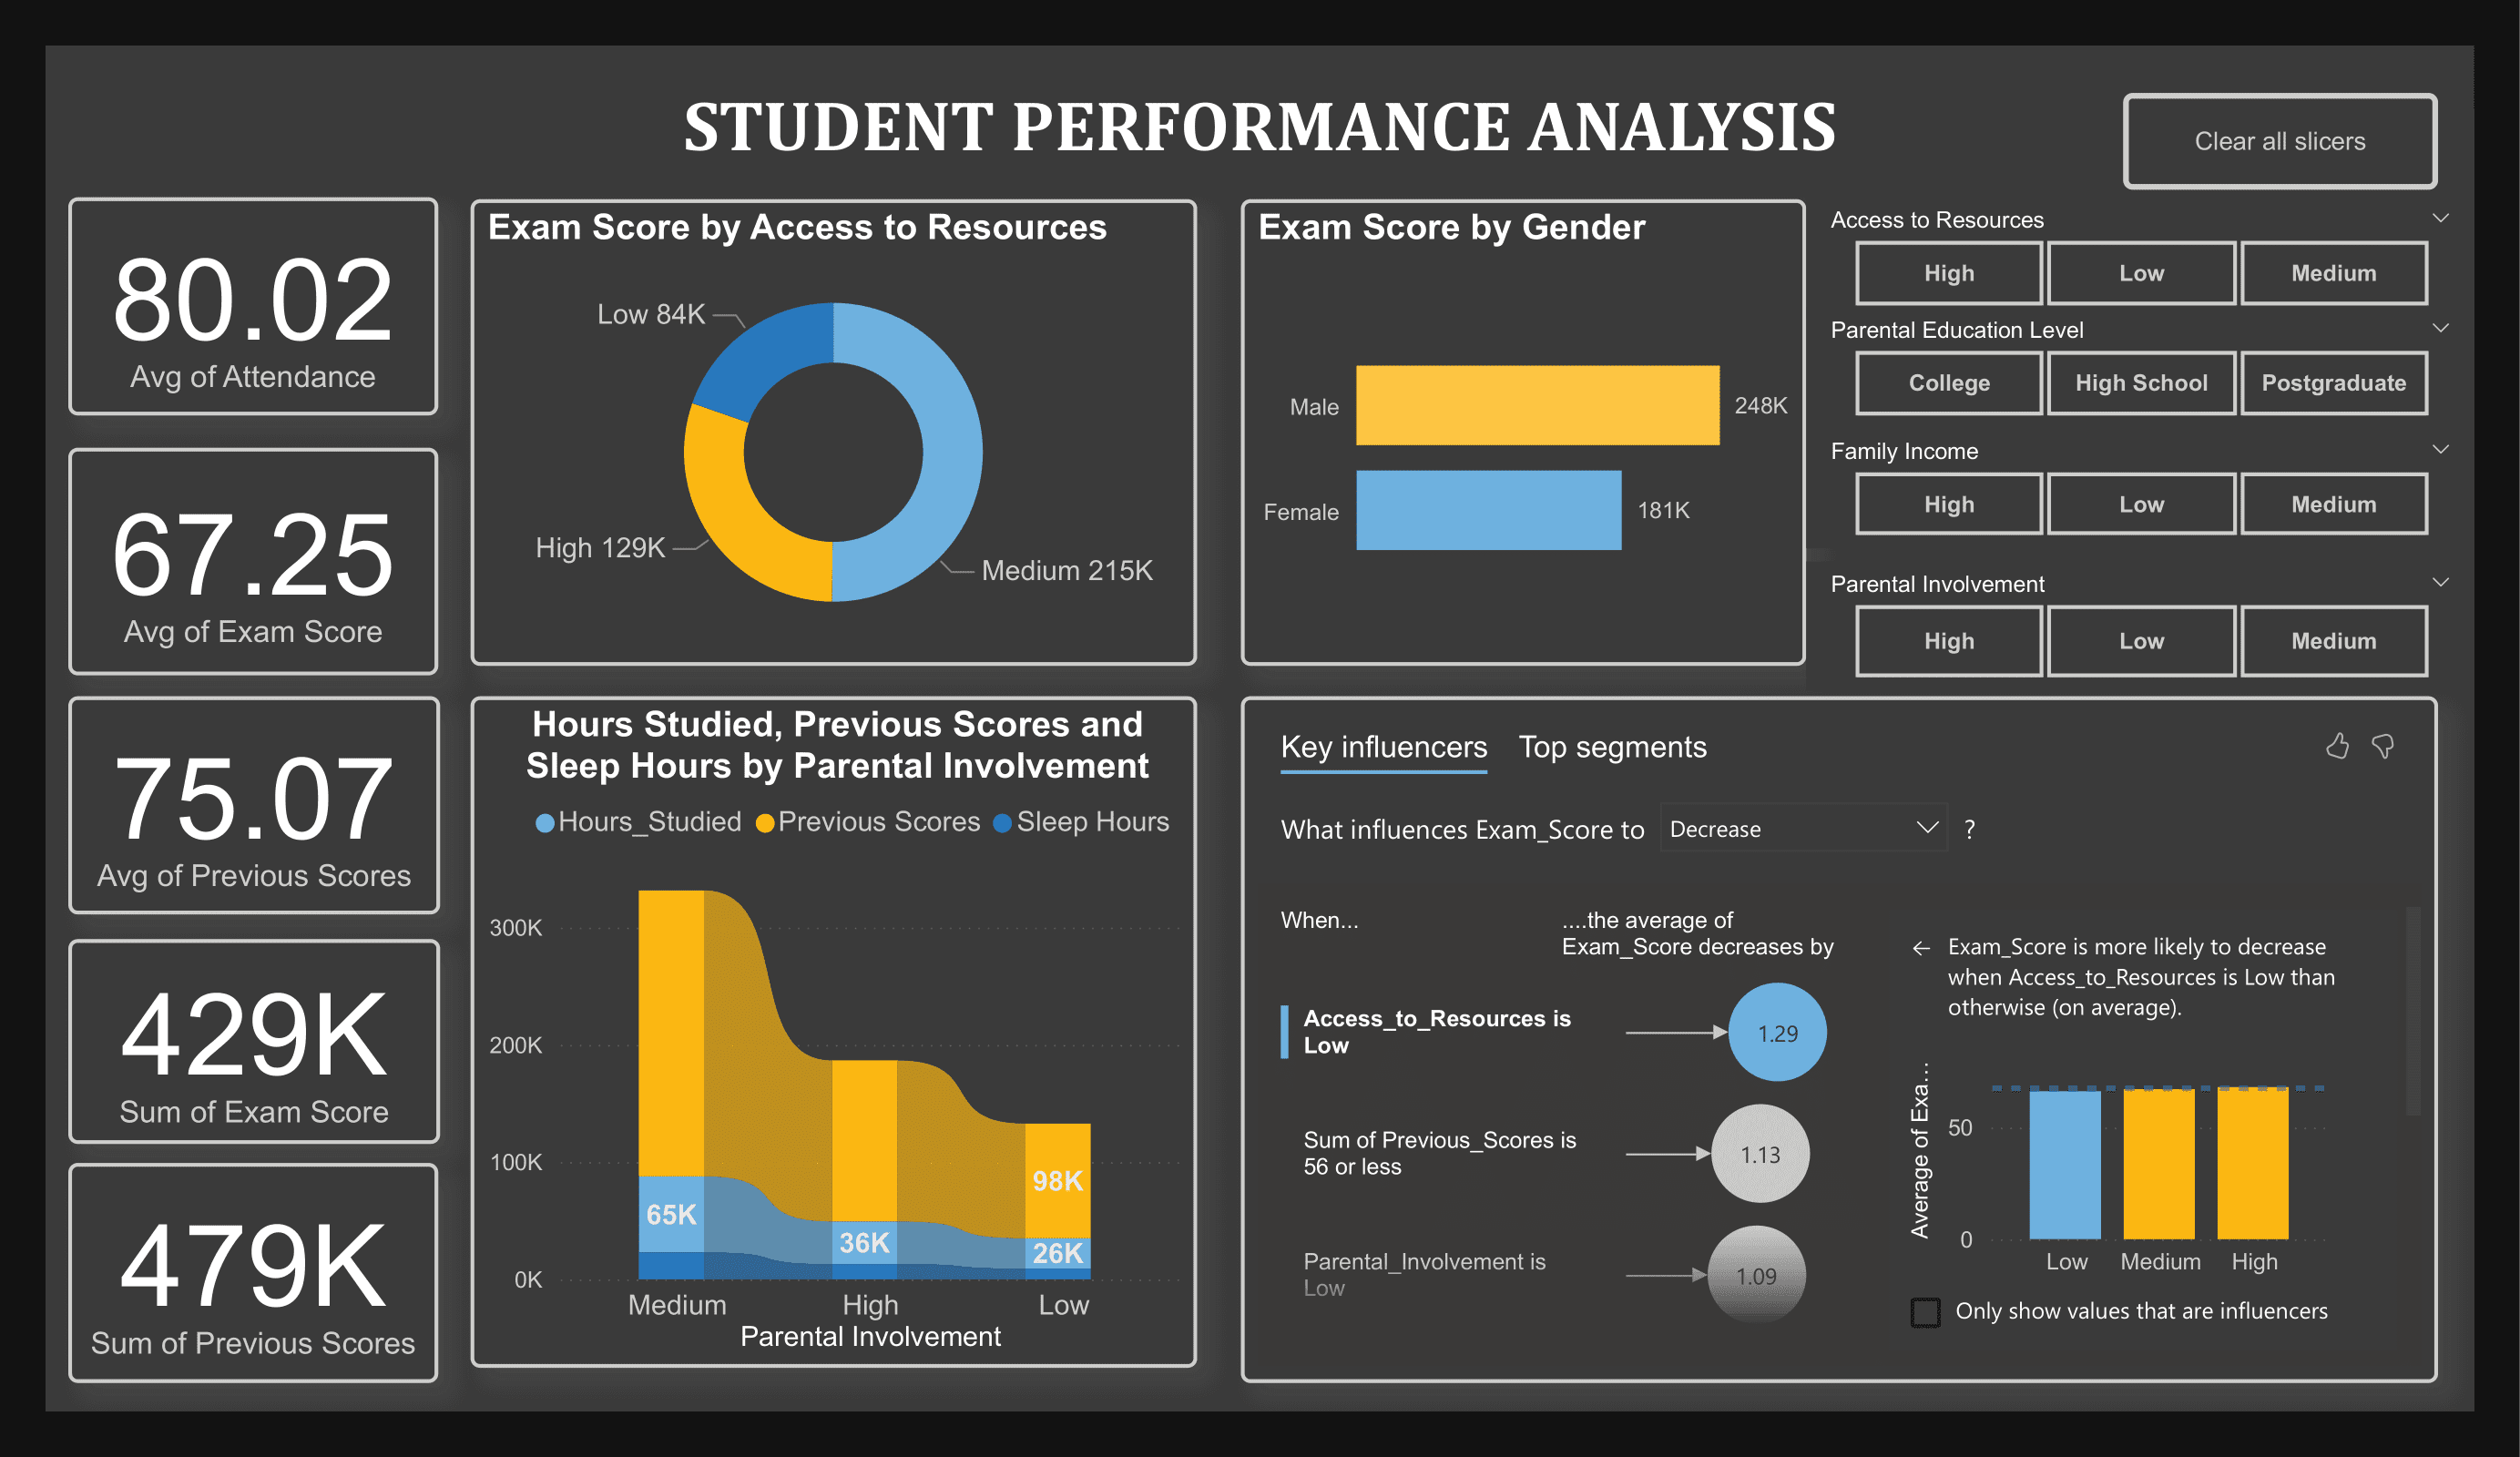
Average attendance is 80.02%, and the average exam score is 67.25%. This suggests a moderate correlation where higher attendance might contribute to better performance, but other factors also play a role.
Gender-wise Exam Scores:
Male students scored an aggregate of 248K, while female students scored 181K, indicating a gender disparity in exam scores that may warrant further analysis.
Impact of Parental Involvement:
Students with high parental involvement tend to have higher hours studied, previous scores, and sleep hours. This reinforces the importance of parental support in academic success.
Resource Access and Exam Performance:
Students with higher access to resources scored an aggregate of 215K, compared to those with low access at 84K. This points to a significant impact of resource availability on academic outcomes.
Influence of Previous Scores:
Students with prior high scores (75.07% on average) tend to perform well, indicating that consistent academic effort positively impacts future performance.
Key Influencers of Exam Score Decline:
Exam scores tend to decrease notably when:
- Access to resources is low.
- Previous scores are 56 or below.
- Parental involvement is low.
These factors are critical for identifying at-risk students and implementing targeted support measures.
Attendance and Exam Score Averages:
Average attendance is 80.02%, and the average exam score is 67.25%. This suggests a moderate correlation where higher attendance might contribute to better performance, but other factors also play a role.
Gender-wise Exam Scores:
Male students scored an aggregate of 248K, while female students scored 181K, indicating a gender disparity in exam scores that may warrant further analysis.
Impact of Parental Involvement:
Students with high parental involvement tend to have higher hours studied, previous scores, and sleep hours. This reinforces the importance of parental support in academic success.
Resource Access and Exam Performance:
Students with higher access to resources scored an aggregate of 215K, compared to those with low access at 84K. This points to a significant impact of resource availability on academic outcomes.
Influence of Previous Scores:
Students with prior high scores (75.07% on average) tend to perform well, indicating that consistent academic effort positively impacts future performance.
Key Influencers of Exam Score Decline:
Exam scores tend to decrease notably when:
- Access to resources is low.
- Previous scores are 56 or below.
- Parental involvement is low.
These factors are critical for identifying at-risk students and implementing targeted support measures.
Sales by Categoy:
The top-performing categories are Office Supplies, Technology, and Furniture, with Office Supplies leading the sales volume.
Sales by Sub-Category:
Phones, Chairs, and Binders are the top sub-categories, highlighting potential areas for focused sales strategies or inventory adjustments.
Shipping Mode Preference:
Standard Class is the most popular shipping option, followed by Second and First Class. Same-day shipping is the least used, possibly due to higher costs or limited availability.
Monthly Sales and Profit Trends:
Sales and profits vary seasonally across 2019 and 2020, with some months showing higher performance. This data helps identify peak sales periods.
Customer Segment Sales Distribution:
Consumer segments represent the largest sales share (48%), followed by Corporate (33%) and Home Office (19%). This breakdown can guide targeted marketing initiatives.
Payment Mode Breakdown:
Cash on Delivery (COD) is the most common payment mode, followed by online and card payments. This could reflect customer trust in COD or regional payment preferences.
Regional Sales Performance:
The West region leads in sales, followed by the East, South, and Central regions. This insight can aid regional-focused strategies to maximize revenue.
Sales Forecast:
Projected sales for November 2020 through January 2021 provide estimates for future planning and inventory stocking.